Finding SEO benchmarks to measure your organization’s performance against can be tricky. Especially for B2B companies, as most metrics are gathered from B2C websites. In addition, SEO benchmarks tend to focus solely on organic traffic and conversion rate.
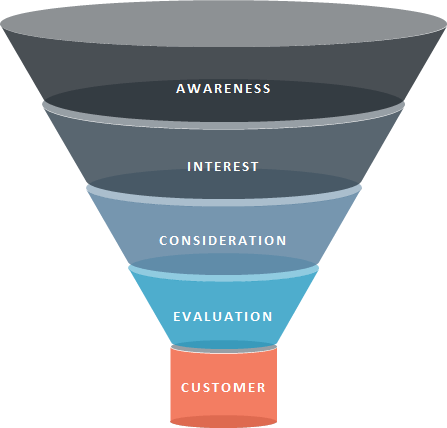
A well-rounded B2B SEO strategy has to take into account the longer B2B sales cycle and focus on all stages of the sales cycle.
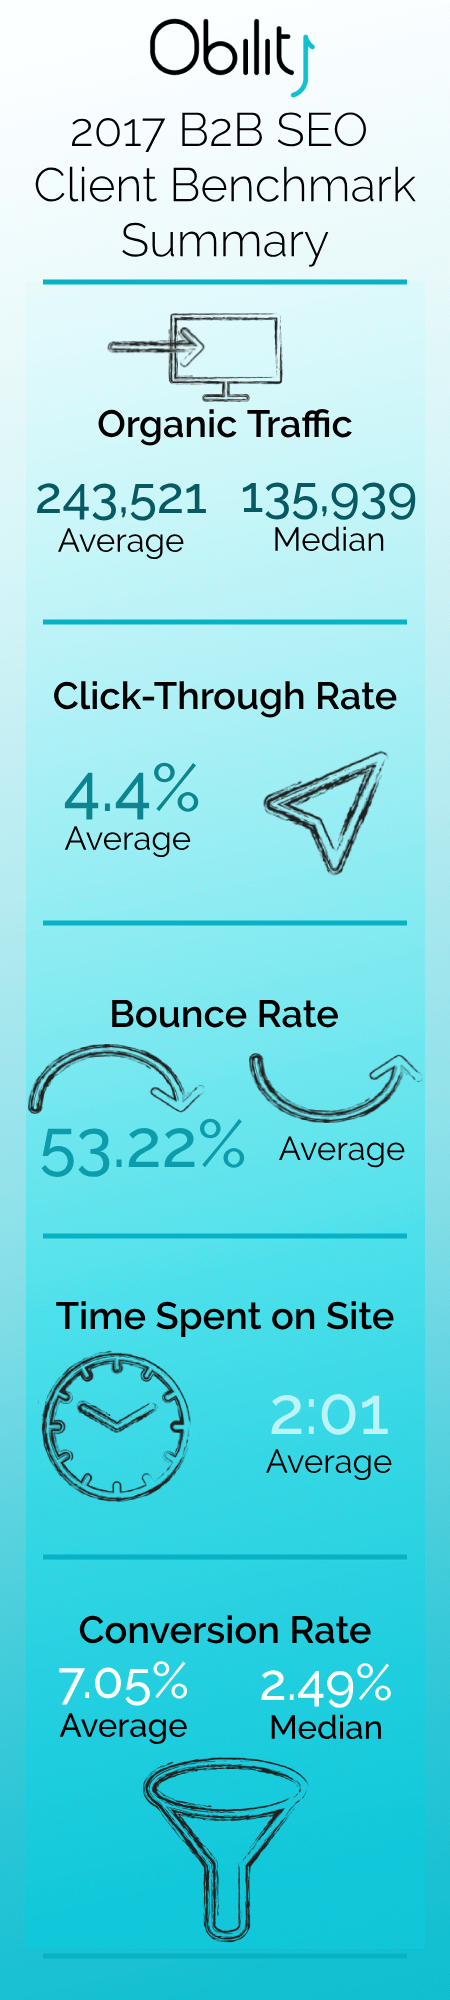
For that reason, SEO success can’t be measured with organic traffic and conversions only. When reporting on SEO performance, Obility also focuses on user experience metrics such as bounce rate, time on site, and click-through-rate.
We have compiled several on-site metrics for the clients that have been with Obility for the full year of 2017.
Not all our clients are at the same stage of their SEO strategies, some clients have been with us for years and have a mature SEO strategy while other clients went through a rebrand and started a brand new strategy mid-year. For that reason, we will look at all clients separately and the overall average.
Organic Traffic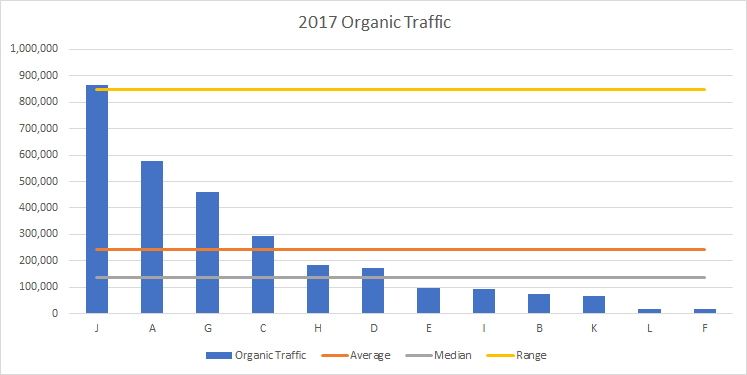
Obility clients’ organic traffic performance in 2017 varied from as little as 1,400 visits per month to over 48,000 monthly visits. On average, our clients got 243,521 visits yearly, or 20,293 monthly.
Since our clients’ range is so wide (close to 850,000) it’s interesting to look at the median traffic of 135,939 visits for 2017.
Organic Click-Through Rate
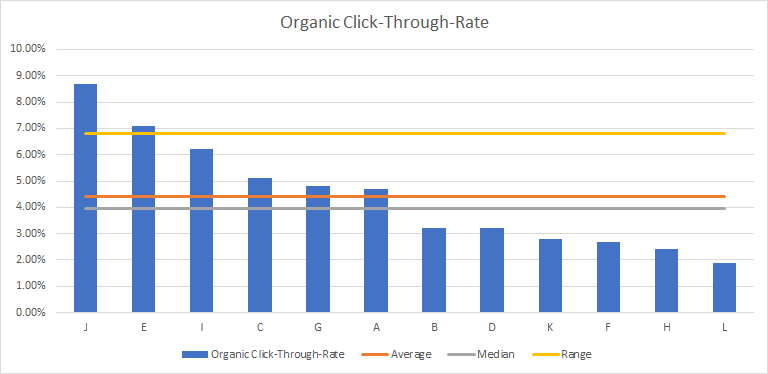
Click-through rate is a really good indicator of your site’s performance in the SERP and a good replacement for keyword-level data that Google took away from us in 2013, since Search Console allows us to see which keyword is associated to which page.
Organic Bounce Rate & Time Spent on Site
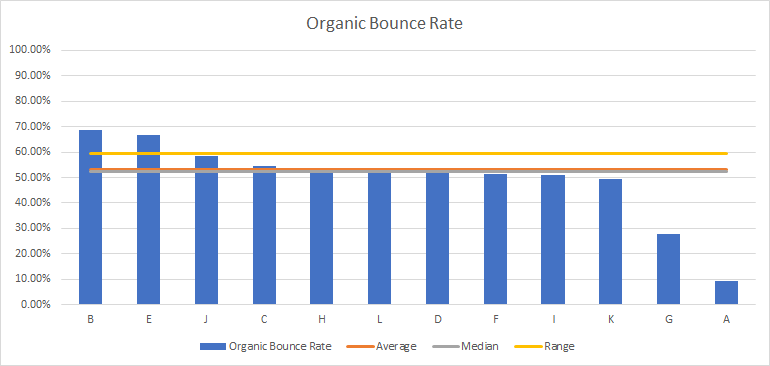
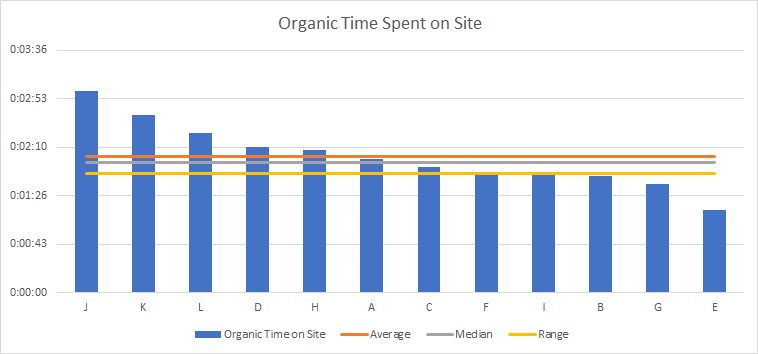
Bounce rate and time on site are good indicators of the user experience performance on your website performs. They go hand-in-hand, improved bounce rate will also help improve the time spent on site. On average, users spent 02:01 minutes on our clients’ websites with an average bounce rate of 53.22%.
Note: Client A was not included in the average due to their bounce rate resulting from a tracking issue.
Conversion Rate
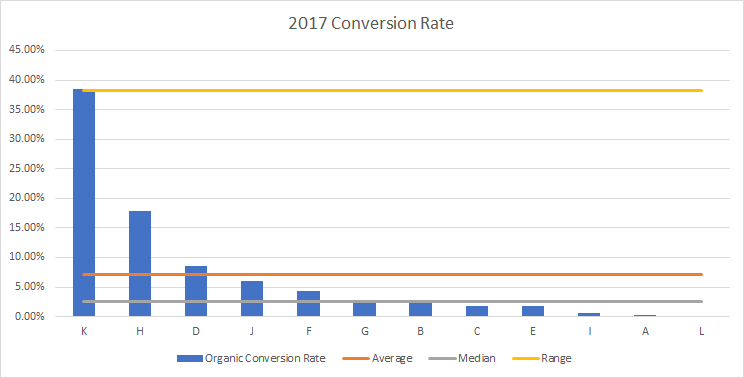
Many articles claim that a good conversion rate is around 2%. However, it is easy to manipulate conversion rate to make it very low or very high, so giving an absolute number to determine what is “good” or “bad” is not helpful if we don’t understand what is considered a conversion.
Obility doesn’t count a page view (even the contact us page) or a certain amount of time spent on a page a conversion. Rather, we focus on actions that translate to customer interest, such as filling a form, downloading an eBook, or registering for a webinar. The variety of conversion points explains the discrepancies between conversion rates, a website with multiple webinars and gated resources will have a higher conversion rate.
We’re looking at another wide range with conversion rate at 38.26%, with an average of 7.05% and median of 2.49%.
Of course, there are many more ways to measure SEO performance and each client should focus on what SEO success means for them, but hopefully the benchmarks above will help you assess your current performance and give you a better understanding on the SEO B2B space.
If you’re interested in learning about how SEO can help your company’s digital marketing strategy and performance, contact Obility today with your questions.