The top navigation bar is one of the most utilized elements on your website. New and returning users both interact with your top navigation bar multiple times per visit and having a user-friendly and comprehensive top nav bar is crucial for good user experience, and is an important part of conversion rate optimization, especially in the B2B world where users will visit your website dozens of times before making a buying decision.
In this blog post, we’re going to look at how to create the necessary tags and triggers in Google Tag Manager, how to report on performance in Google Data Studio and how to analyze the results to improve your top nav bar.
I. Creating the Google Tag Manager Tag and Trigger
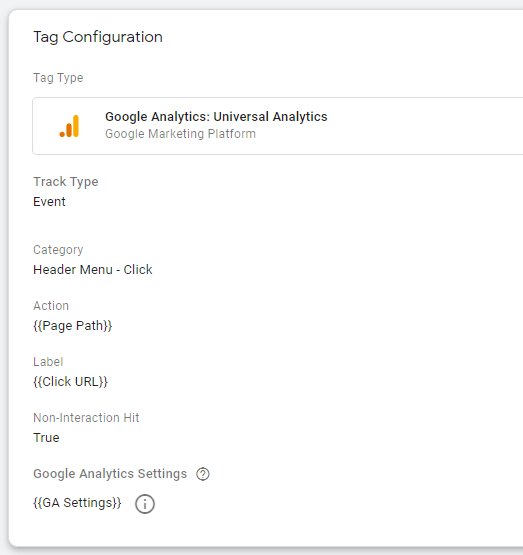
Let’s start by creating the Google Tag Manager tag and trigger.
The process is pretty simple, I like to track the page path (the page where users interact with the top nav) as an action and the link users clicked on as the label, so I’ll know which pages led to the most top nav clicks and which links were clicked on the most.
Then, for the trigger, you will want to look at the page source and use the div class as the firing element for your Click URL trigger:

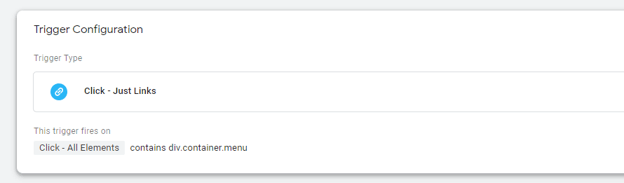
Make sure to test your new tag to make sure you’re only recording clicks on the top nav and all top nav links are being properly recorded.
II. Reporting in Google Data Studio
Once your tags are properly firing, you can build a custom report in Google Data Studio.
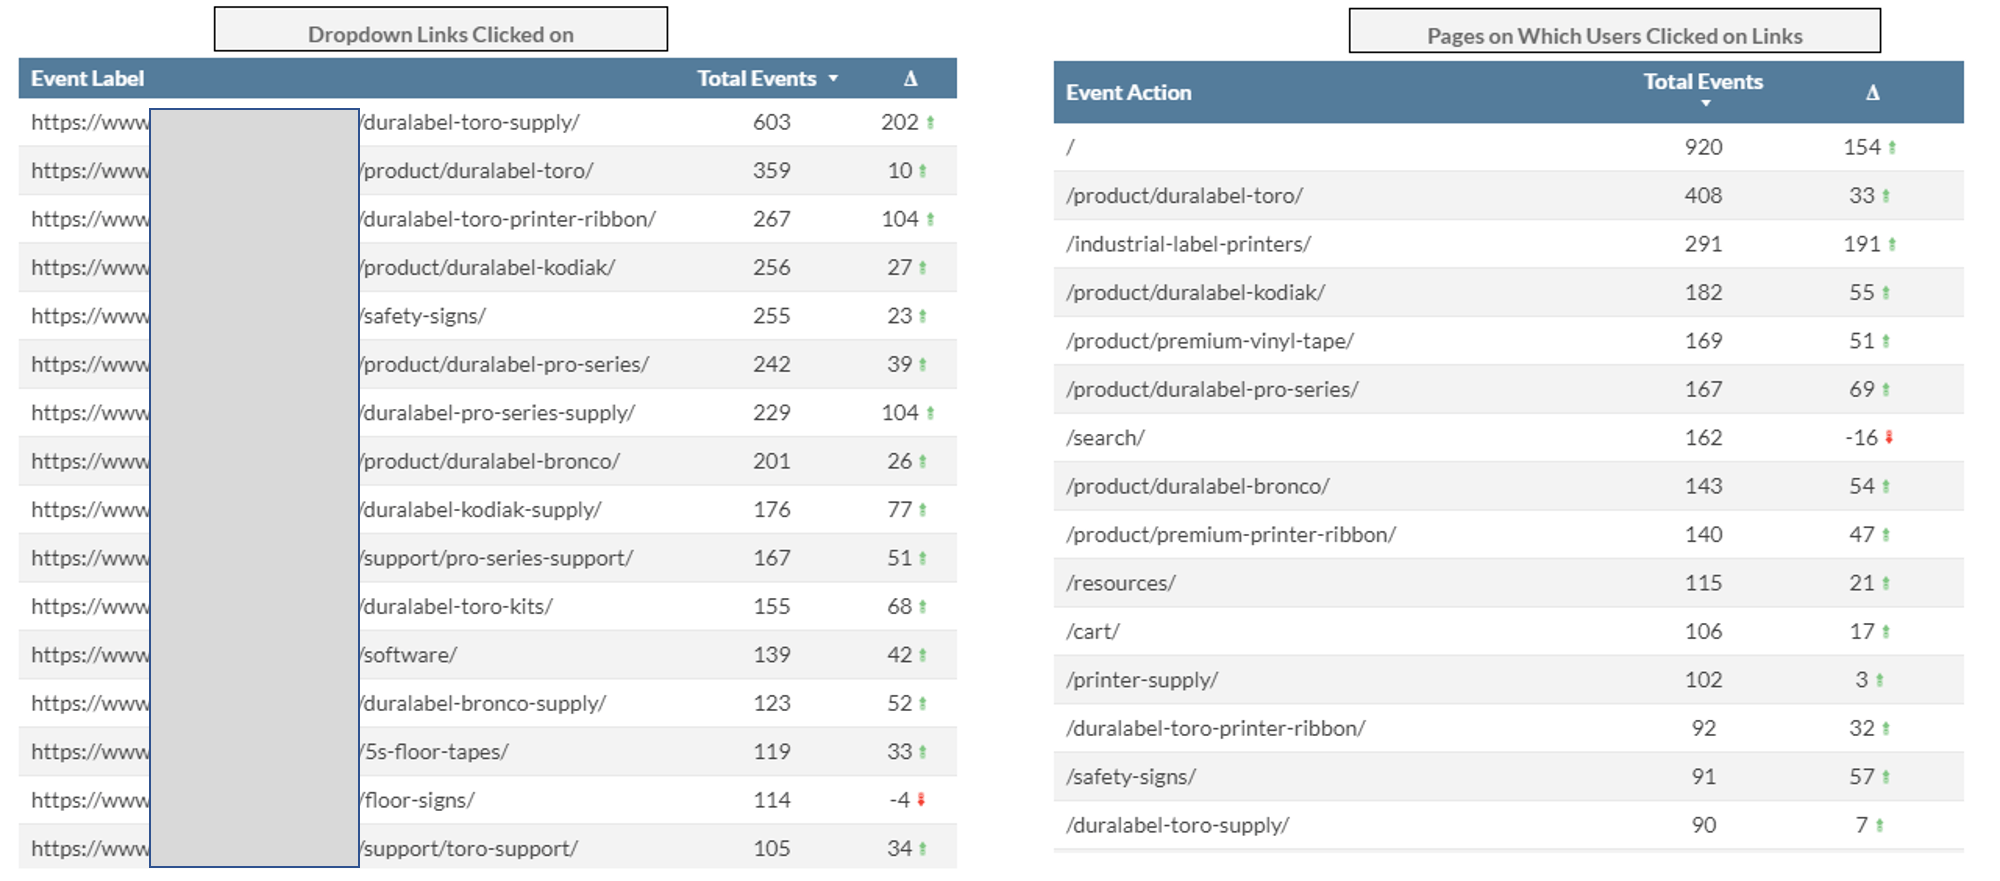
I like to use tables, filtered by the Google Tag Manager event category name so only top nav clicks will be pulled in, the total number of events (aka clicks), and MoM delta change. As you can see, I’m tracking both the page where the action took place and the clicked link.
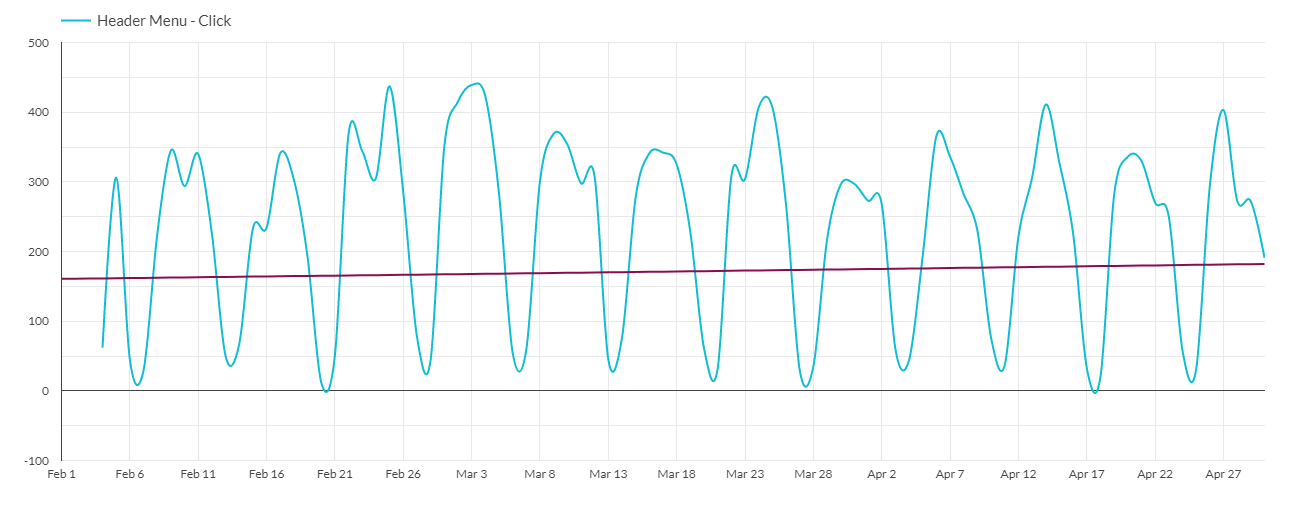
For a higher-level view, you can create a line chart that will show you the total number of clicks with a trendline:
III. Auditing Results
After a few months of tracking, you should be able to see some trends and uncover some opportunities for improvement.
For example, if you start seeing a drop in conversions in your resource center, it could be an opportunity to update your top nav to add direct links to the different resource types.
Or, if the blog is not seeing as much traffic as it used to, you could experiment with A/B testing the look or position of the link to the blog. Even the order of the links in the dropdown matter. I would recommend doing heatmapping on your website at the same time, so you can see what percentage of users see the top nav and the dropdown links.
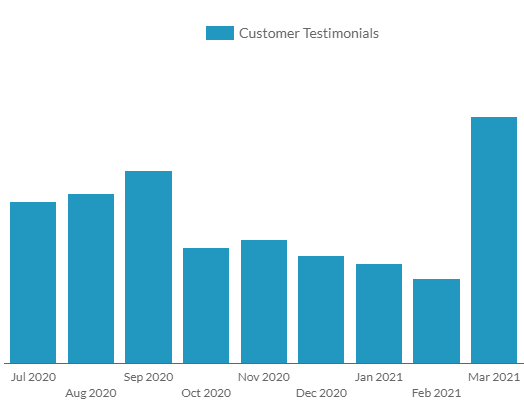
In the example below, we noticed a downward trend with customer testimonials conversions, so we broke down the “Videos” top nav link to feature “Customer Testimonials” and “Employee Testimonials”, which led to an immediate increase in customer testimonials downloads:
This method is also great to track the before and after performance of a new header, especially during a redesign or site migration.
Tracking the performance of your top navigation bar is a fairly straightforward process that can help you uncover new optimization opportunities, facilitate user experience and improve conversion rate!